Preferences
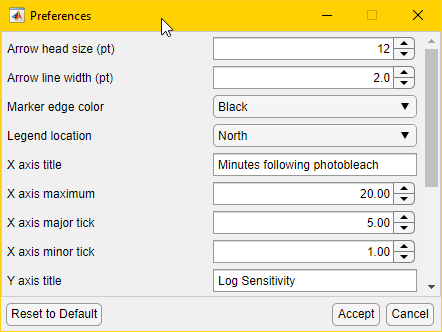
The preferences dialog contains customization options that affect the entire plot. These options will be reflected in the plot as you change them, but will only be saved once you click “Accept”. Clicking “Cancel” will revert any changes made since opening the dialog. Closing the dialog without clicking any buttons has the same effect as “Cancel”. Clicking “Reset to Default” will revert all preferences to their default values. This can be undone by clicking “Cancel” or closing the dialog without clicking “Accept”.
Arrow Appearance
Arrow head size (pt) - Changes the height and width of the arrowhead in points. Default: 12
Arrow line width (pt) - Changes the width of the arrow line in points. Default: 2.0
Marker Appearance
Marker edge color - Allows selecting the edge color of all markers. Default: Black
Same - same as the marker color selected in the table. Effectively, this means no marker edge color.
Black - solid black marker edge.
Invert - The closest CIELAB inverse color in the sRGB space. This should always produce high hue contrast, but may not give very good lightness and saturation contrast.
Legend
Legend location - The location of the legend based on MATLAB built-in options. Not all options are available for aesthetic and practical reasons. Default: North
North, NorthEast - inside the axes, near the top
South, SouthEast - inside the axes, near the bottom
East - inside the axes to the right
NorthOutside, SouthOutside, EastOutside - outside the axes, as above
Best - inside the axes, minimizes overlap of legend and plot data
BestOutside - outside the axes, top-right corner
Axes
X axis - Time since start of experiment
title - Title or label of X axis. Default is research publication standard. Default: Minutes following photobleach
maximum - Maximum value in minutes. Default: 20.00
major tick - enumerated ticks. Default: 5.00
minor tick - non-enumerated ticks, set equal to major tick to hide. Default: 1.00
Y axis - Sensitivity to light
title - Title or label of Y axis. Default: Log Sensitivity
minimum - Minimum value in dB. Default: 0.00
maximum - Maximum value in dB. Default: 5.00
major tick - enumerated ticks. Default: 1.00
minor tick - enumerated ticks. Default: 0.50
Export
Desired export size (px) - Size of exported rasterized
pngfile in pixels. This value affects the relative size of objects in vectorpdfandepsfiles as well. Use a consistent value if you need multiple plots in the same publication. Default: 500.Default export extension - Which extension should be the default choice when exporting. Default: .png